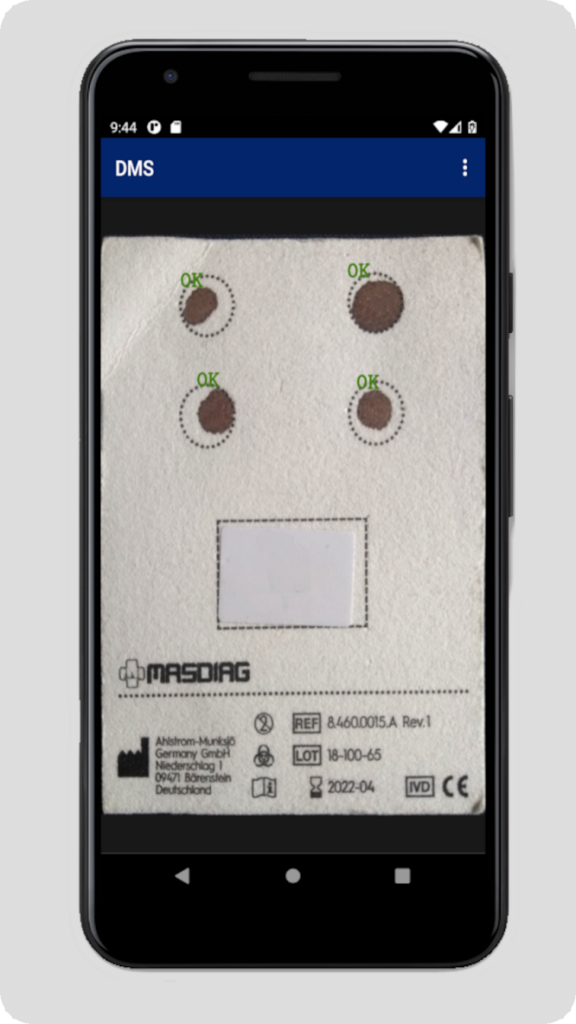
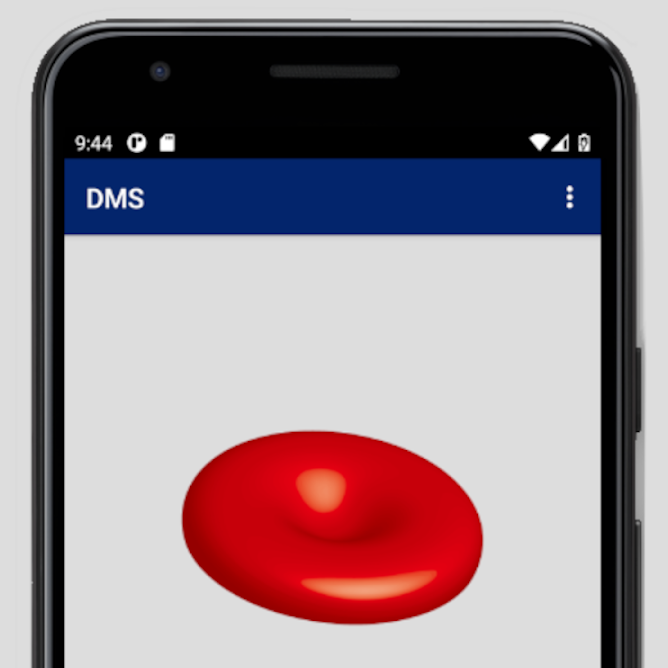
The dry spot analysis has become so popular that even self-sampling kits are now available. However, many external factors can affect the analytical value of the sample. First of all, there is a risk of error during sample collection by a patient — blood can be squeezed out or rubbed on the surface of the paper. Moreover, some stamps or pen inscriptions may contaminate the surface and affect the measurement results. The following factors are also analytically significant: the volume of the sample and the sample cutting place. In order to pass these obstacles, a quasi-intelligent device and algorithm for checking and preparing samples has been created. The experience has been scaled to mobile devices for the purpose of sample validation.
Blood drops with the volume of 10 to 70 μl, respectively, were applied to the specified fields of the TFN. The developer version of an automatic disc puncher with two cameras facing each other has been created. Thanks to quasi-intelligent image processing algorithms, it is possible to measure a blood spot and its surface on both sides with relatively small error ok 0.15%$. The created algorithm can also verify the correctness of the sample in a mobile application. The device measured and cut the discs from prepared samples. After that, the discs were extracted with a mixture of methanol: water (8:2) in the case of amino acids and pure methanol in the case of metabolites of Vitamin D. The content of 25(OH)D3, 24.25(OH)2D3 and selected amino acids were analyzed using LC/MS.
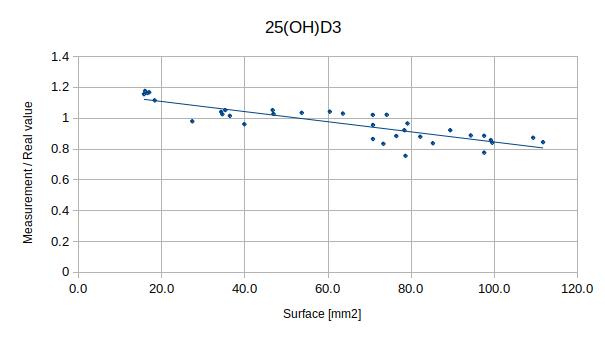
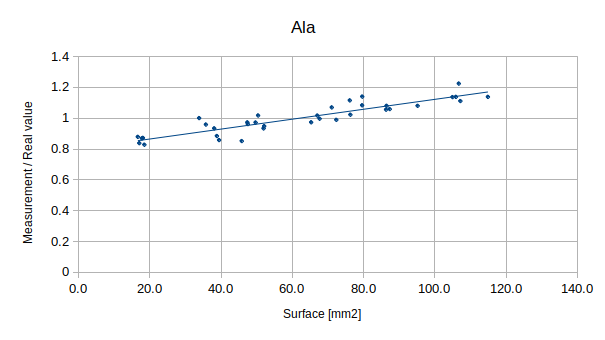
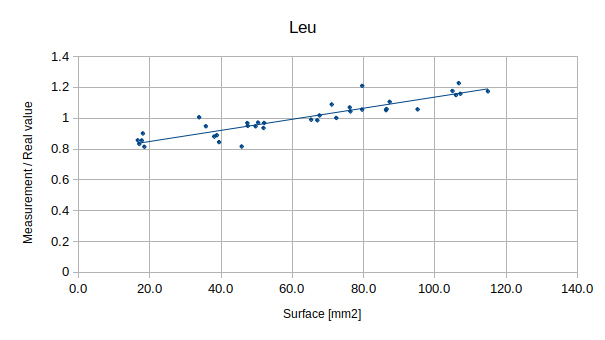
Based on pictures taken from both sides, the quality of sampling and the size of the spot have been evaluated. The aim of this study was to check if there is a correlation between measured concentration and the area of blood spot used for measurement. All tested samples were prepared by pooled blood, so the concentration of amino acids and metabolites of vitamin D were the same in all spots. The only difference between spots was the volume of blood. The obtained results have shown that there is a correlation (R2>0.5) between the area of the dry blood spot area and measured concentration. The highest correlations (R2>0.8) were obtained for threonine (Thr), alanine (Ala), valine (Val), isoleucine (Ile), and leucine (Leu). For most cases, the results of measurements correlated more strongly with the area of bottom surface of the paper.
For the vitamin D derivative: 25(OH)D3, 24,25(OH)2D3, epi-25(OH)D3, the correlation was 0.79, 0.76, 0.73, respectively. The detailed result from the vitamin D test is presented in Figure. The measured surface (in mm2) of the blood drop is presented on the X-axis, while the Y-axis shows the ratio between the measurement and their average. Using the trend lines we calculated a fixing coefficient for the measurements. The mean square error calculated for the obtained results (with the usage of the calculated fixing coefficient) was 1.44, 0.11, and 0.13 respectively for each derivative.
The obtained results were used to prepare a machine equipped with an algorithm that corrects the results depending on the relationship and the size of the blood drop applied to the blotting paper.
